
Australia has the 13th highest average salary in the world. [1] This may sound good on paper, but considering that the country also has the 10th highest cost of living, you may not find your money stretching that far in day-to-day life. [2]
The average take-home salary varies significantly across the country, but just because somewhere, like Perth or Melbourne, for example, has the most generous salaries doesn’t mean you’ll necessarily be better off living there, according to the data. [3]
In this study, we looked at the local rent, utilities, public transport, and food costs in the 20 most populated cities around Australia and compared these prices to the local median net income to reveal where your wage gets you the furthest.
Key findings:
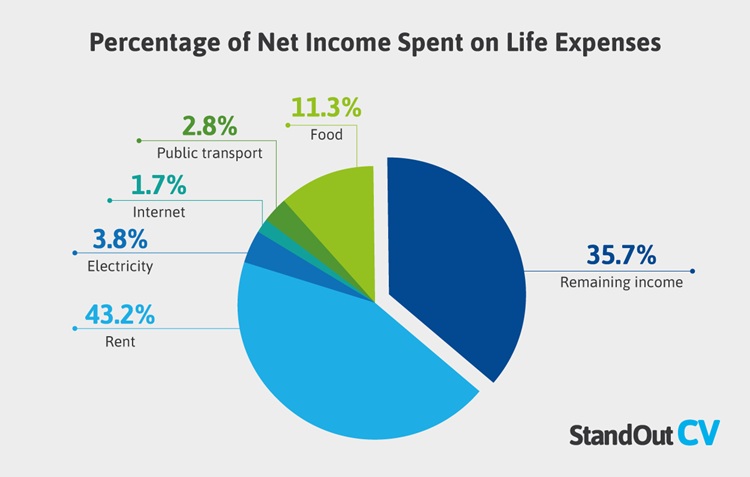
- 64.3% of an average net salary ($53,541) goes on basic life expenses (rent, electricity, gas, internet, and food), leaving $19,124 spare.
- Cost of housing crisis: 43.2% of the net income is spent on rent alone ($23,105 annually, or $444 a week).
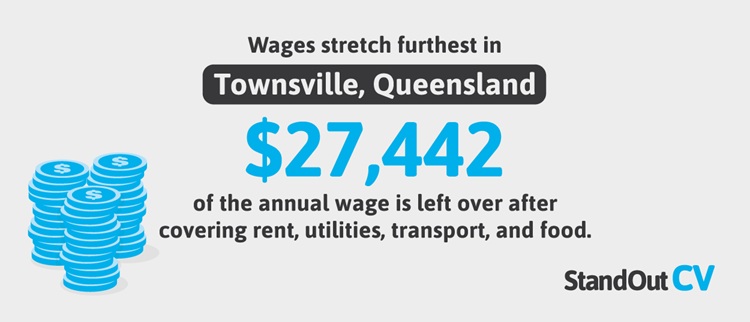
- In Townsville, Queensland, residents have the most leftover income after basic life expenses: $27,442.
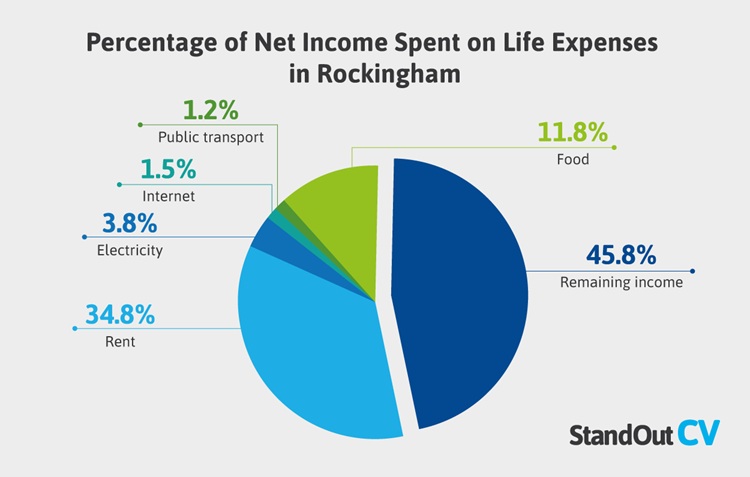
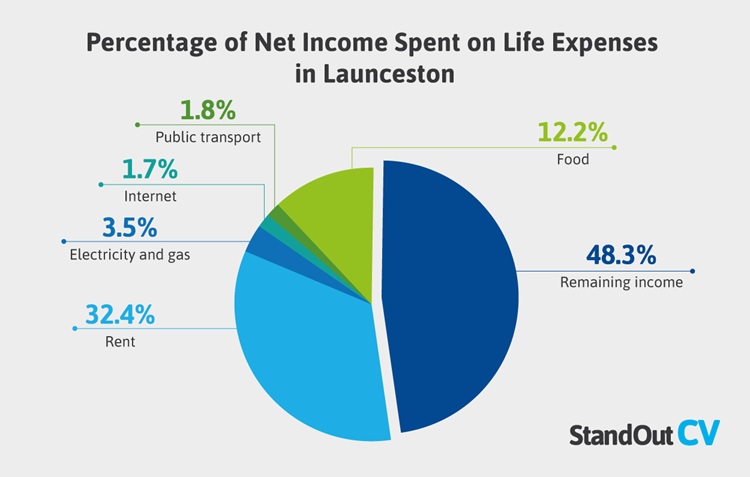
- Rockingham ($26,887 remaining) and Launceston ($25,664) are the second and third best major cities for affordability.
- In the Gold Coast, Queensland, residents have the least leftover income after basic life expenses: $10,127.
- Canberra ($14,978 remaining) and Geelong ($15,166) are the second and third worst major cities for affordability.
How far does your wage go on average on a median Australian wage?
The study considered six basic life expenses: rent, utilities (including electricity, gas, and internet), grocery costs, and a monthly pass for local public transport.
We chose rent over mortgage repayments for this study, as mortgage repayments would assume someone already had the funds to place a deposit on a home. Public transport costs (a local monthly pass) were considered rather than the cost of fuel for a car, as this is also more financially accessible.
Considering the study’s average net income ($53,541) and the study’s averages for rent, electricity, gas, internet, public transport, and food, 64.3% of this ($34,417) goes on covering one person’s basic needs, leaving $19,124 spare.
Taking a study average, 43.2% of the net salary is spent on rent. To put this in a wider context, in Germany, the national average is around 27.8%, and in the UK, it is around 36%. [4] [5] followed by food (11.3%).
| Annual income and expenditures (with a net median income of $53,541) | ||
|---|---|---|
| Expense | Annual cost | % of all costs |
| Rent | $23,105 | 43.2% |
| Electricity | $2,061 | 3.8% |
| Gas | $791 | 1.5% |
| Internet | $930 | 1.7% |
| Public transport | $1,476 | 2.8% |
| Food | $6,055 | 11.3% |
| Total cost | $34,417 | 64.3% |
| Total remaining | $19,124 | 35.7% |
*as all percentages are rounded to the nearest decimal point, the sum is slightly over 100%.
Where your wage goes the furthest
One of our studies found that one in three Australians would take a pay cut to achieve a better work-life balance. The grind isn’t for everyone, so where in Australia can you get the most for your money? Below, we highlight the top five best cities to live in to stretch every dollar the furthest.
| The top 10 Australian cities where your money goes furthest | |||||
|---|---|---|---|---|---|
| Rank | City | Region | Net median local salary | Remaining income | % of net wage spent on rent, utilities, transport and food |
| 1st | Townsville | Queensland | $56,858 | $27,442 | 51.74% |
| 2nd | Rockingham | Western Australia | $58,702 | $26,887 | 54.20% |
| 3rd | Launceston | Tasmania | $53,144 | $25,664 | 51.71% |
| 4th | Wollongong | New South Wales | $59,612 | $25,135 | 57.84% |
| 5th | Melbourne | Victoria | $60,051 | $24,078 | 59.90% |
| 6th | Perth | Western Australia | $57,805 | $21,171 | 63.37% |
| 7th | Ballarat | Victoria | $48,879 | $20,171 | 58.73% |
| 8th | Hobart | Tasmania | $55,711 | $19,781 | 64.49% |
| 9th | Brisbane | Queensland | $56,568 | $19,724 | 65.13% |
| 10th | Bendigo | Victoria | $47,712 | $19,284 | 59.58% |
1. Townsville, Queensland
Thanks to relatively high salaries (at $56,858 after income tax), half of the net income (51.7%) goes on covering the basics: rent, utilities, transport, and food. This means that $27,442 is left to spend on ancillary costs (like entertainment, subscriptions, personal products, and savings).
Townsville also has the third-cheapest monthly grocery bills ($460), the fourth-cheapest gas prices ($766 per year), and the fifth-cheapest rent ($364 per week).
| Annual Spend on Life Expenses in Townsville | ||||||
|---|---|---|---|---|---|---|
| Rent per year | Electricity | Gas | Internet | Public transport | Food | Remaining income |
| $18,905 | $1,969 | $766 | $912 | $1,344 | $5,520 | $27,442 |

2. Rockingham, Western Australia
Rockingham, in Western Australia, is the 2nd best city in the analysis. An estimated $31,815 of the $58,702 net income is spent on the basics, leaving $26,887 per year. Besides Perth (which is 45 minutes away from Rockingham), the city has the cheapest yearly gas prices ($588). The city also has the second-most affordable internet costs ($888 a year) and the second-cheapest public transport ($59 a month or $708 a year).
| Annual Spend on Life Expenses in Rockingham | ||||||
|---|---|---|---|---|---|---|
| Rent | Electricity | Gas | Internet | Public transport | Food | Remaining income |
| $20,455 | $2,252 | $588 | $888 | $708 | $5,376 | $26,887 |
3. Launceston, Tasmania
Considering rent, utilities, transport, and food, you need to spend just 51.7% of the average net salary ($53,144) to afford the basics, leaving $25,664 to spend on ancillary costs. Launceston had the cheapest average rental prices in the study at $331 per week ($17,232 per year), which is 25.5% less than the $444 study average. Launceston also has the 5th cheapest public transport costs in the study at $80 a month ($960).
| Annual Spend on Life Expenses in Launceston | |||||
|---|---|---|---|---|---|
| Rent | Electricity & Gas* | Internet | Public transport | Food | Remaining income |
| $17,232 | $1,864 | $920 | $960 | $6,504 | $25,664 |
*The source provides a combined quote for electricity and gas, rather than separate quotes.
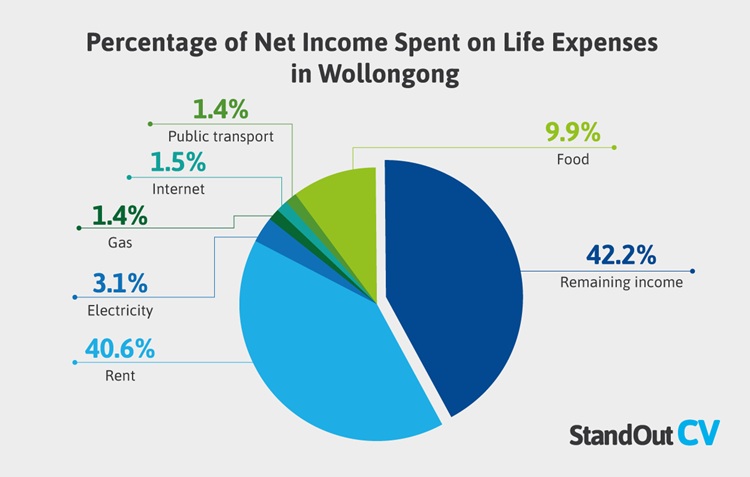
4. Wollongong, New South Wales
The coastal city of Wollongong, New South Wales, is the 4th most affordable city in the study, leaving residents with $25,135 per year after the six expenses were accounted for.
The New South Wales city had the 4th most affordable internet per year (at $900 per year), and the 4th cheapest transport costs (at $72 per month or $864 per year). The annual electricity bill in Wollongong is also the 5th cheapest of the 20 cities ($1,827).
| Annual Spend on Life Expenses in Wollongong | ||||||
|---|---|---|---|---|---|---|
| Rent | Electricity | Gas | Internet | Public transport | Food | Remaining income |
| $24,174 | $1,827 | $820 | $900 | $864 | $5,892 | $25,135 |
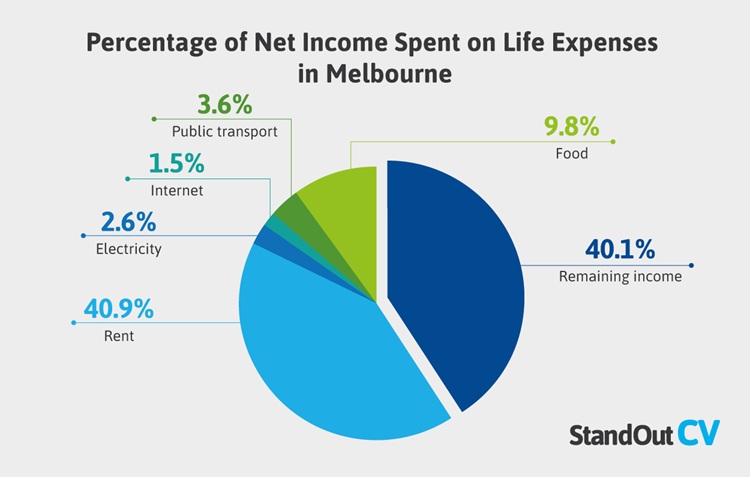
5. Melbourne, Victoria
Australia’s second-most populous city, Melbourne, wins the 5th-best score in the study. 59.9% of the median net salary ($60,051) goes on the six basic expenses, leaving $24,078.
After Sydney (which ranked 13th out of 20), Melbourne has the second-highest median salary in the study, which is the key reason why the city performed so well (despite rent prices, gas prices, and public transport costs all being greater than average).
Alongside the other cities in Victoria (Ballarat, Bendigo, and Geelong), Melbourne has the most affordable annual electricity bill ($1,571).
| Annual Spend on Life Expenses in Melbourne | ||||||
|---|---|---|---|---|---|---|
| Rent | Electricity | Gas | Internet | Public transport | Food | Remaining income |
| $24,546 | $1,571 | $892 | $912 | $2,160 | $5,892 | $24,078 |
Where your wage goes the least far
On the other hand, there were some cities where residents were far more likely to struggle to afford the local cost of living on the local wage.
| The top 10 Australian cities where your money goes least far | |||||
|---|---|---|---|---|---|
| Rank | City | Region | Net median local salary | Remaining income | % of net wage spent on rent, utilities, transport and food |
| 1st | Gold Coast | Queensland | $48,447 | $10,127 | 79.1% |
| 2nd | Canberra | Australian Capital Territory | $55,602 | $14,978 | 73.1% |
| 3rd | Geelong | Victoria | $47,547 | $15,166 | 68.1% |
| 4th | Cairns | Queensland | $47,623 | $15,365 | 67.7% |
| 5th | Darwin | Northern Territory | $50,862 | $15,550 | 69.4% |
| 6th | Adelaide | South Australia | $52,431 | $15,906 | 69.7% |
| 7th | Logan City | Queensland | $48,272 | $16,019 | 66.8% |
| 8th | Sydney | New South Wales | $63,639 | $16,989 | 73.3% |
| 9th | Newcastle | New South Wales | $54,348 | $17,451 | 67.9% |
| 10th | Toowoomba | Queensland | $47,012 | $18,758 | 60.1% |
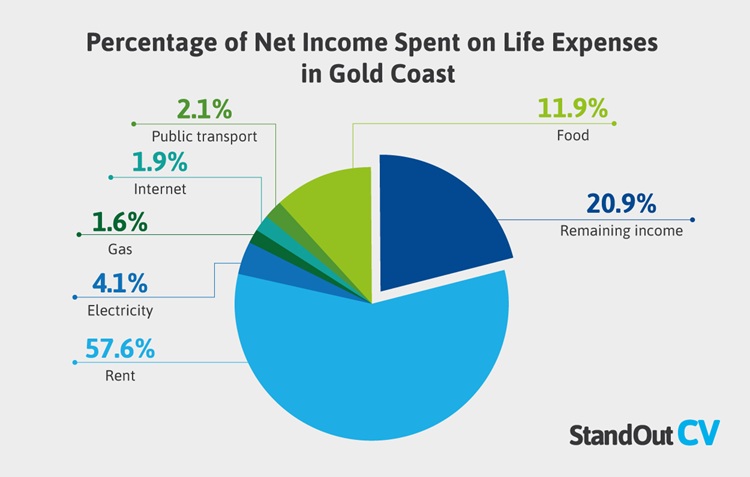
1. Gold Coast, Queensland
This metropolitan region in Queensland is called the “Gold Coast” due to over-inflated prices of real estate and goods in the 1950s. And it seems that the name is still just as relevant, more than half a century on. [6]
A resident can expect to spend 79.1% of their $48,447 net salary on rent, electricity, gas, internet, public transport, and food, leaving just $10,127 to play with. The most influential reason for the Gold Coast’s poor result is real estate. The median weekly rent ($536 or $27,893 a year) is the 2nd most expensive in the study, after Sydney and joint with Canberra.
| Annual Spend on Life Expenses in the Gold Coast | ||||||
|---|---|---|---|---|---|---|
| Rent | Electricity | Gas | Internet | Public transport | Food | Remaining income |
| $27,893 | $1,969 | $766 | $912 | $1,020 | $5,760 | $10,127 |
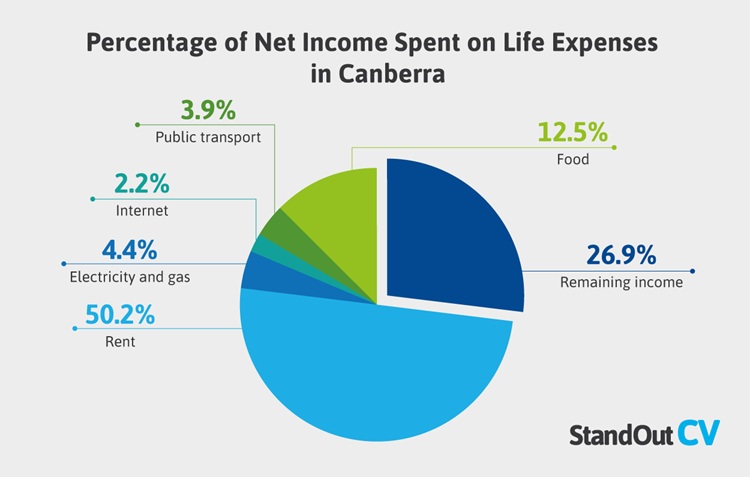
2. Canberra, Australian Capital Territory
Those living in Australia’s capital city can expect to see around 73.1% of a $55,602 median net income to go on necessities, with only $14,978 per year to play with.
Canberra has the joint second most expensive rental market ($536 a week or $27,893 a year). This means that half (50.2%) of the net income goes on housing, considerably above the suggested 30% guideline for tenants. [7] The annual internet bill ($1,199) is also the priciest in the study, and a monthly grocery shop can cost around $577 – $71 above the study average, and the most expensive in the study.
| Annual Spend on Life Expenses in Canberra | |||||
|---|---|---|---|---|---|
| Rent | Electricity & Gas* | Internet | Public transport | Food | Remaining income |
| $27,893 | $2,448 | $1,199 | $2,160 | $6,924 | $14,978 |
*The source provides a combined quote for electricity and gas, rather than separate quotes.
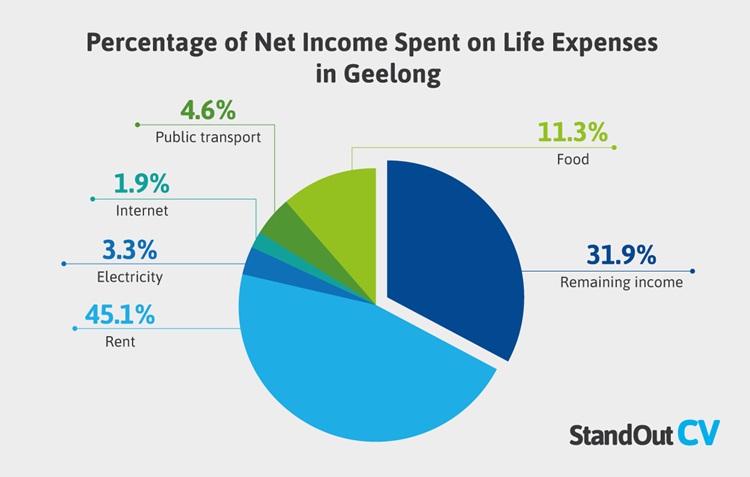
3. Geelong, Victoria
After Melbourne, Geelong is the second-largest city in Victoria. In Geelong (where the median net salary is around $47,547), 68.1% of the net salary goes on covering basic living expenses, with $15,166 left over.
Gas prices in Geelong are the most expensive in the study, at $892 per year (joint with the other cities in Victoria). Public transport costs in Geelong are also the second most expensive in the study (at $182 per month – $59 more expensive than the $123 average). But what makes Geelong particularly unaffordable (especially in comparison to Melbourne) is the low median local salary, which is the 2nd-lowest in the study (after Toowoomba) and $5,994 lower than the study average of $53,541.
| Annual Spend on Life Expenses in Geelong | ||||||
|---|---|---|---|---|---|---|
| Rent | Electricity | Gas | Internet | Public transport | Food | Remaining income |
| $21,446 | $1,571 | $892 | $912 | $2,184 | $5,376 | $15,166 |
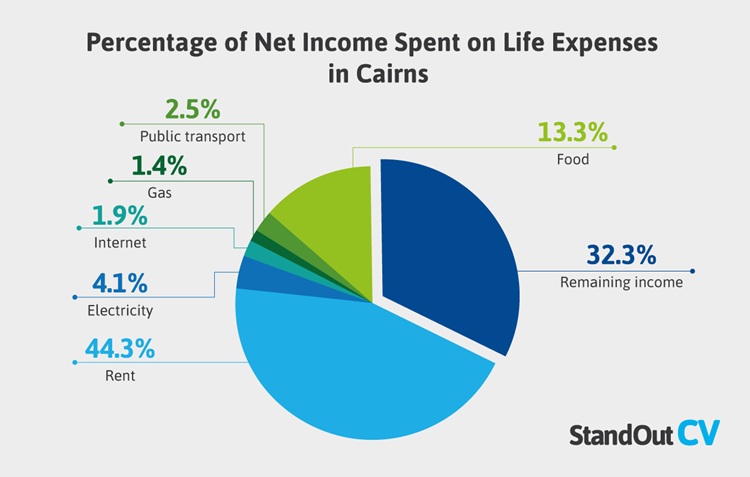
4. Cairns, Queensland
Residents of Cairns can expect to have around $15,365 left over per year after covering their basic expenses, with 67.7% of their local wage covering rent, utilities, public transport, and food.
What makes Cairns so expensive? The cost of five of the six amenities came in below average; only grocery costs were slightly higher than standard (at $528 rather than $505). But it’s the relatively low income that the median salary after tax in Cairns is $47,623, the 3rd lowest in the study after Geelong and Toowoomba.
| Annual Spend on Life Expenses in Cairns | ||||||
|---|---|---|---|---|---|---|
| Rent | Electricity | Gas | Internet | Public transport | Food | Remaining income |
| $21,075 | $1,969 | $766 | $912 | $1,200 | $6,336 | $15,365 |
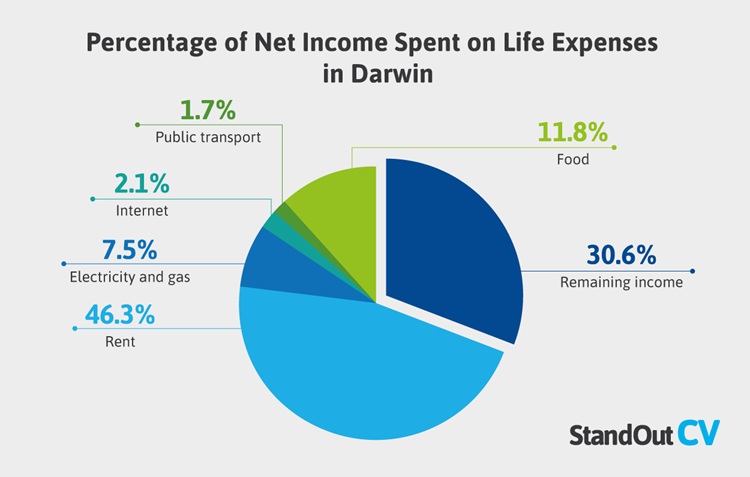
5. Darwin, Northern Territory
Another coastal city completes the worst five: Darwin. Residents of the Northern Territory capital can expect to see around 69.4% of their paycheck spent on basic life expenses, leaving just $15,550 for ancillary costs.
Darwin has one of the most expensive utility bills in the study. Combined, electricity and gas cost around $3,816 per year ($964 dearer than the $2,852 combined average). Darwin also has the second-most-expensive internet costs ($1,090 per year). Considering that the average net salary of $50,862 is below the study average of $53,541, residents of this city might feel more financially squeezed.
| Annual Spend on Life Expenses in Darwin | |||||
|---|---|---|---|---|---|
| Rent | Electricity & Gas* | Internet | Public transport | Food | Remaining income |
| $23,554 | $3,816 | $1,090 | $840 | $6,012 | $15,550 |
*The source provides a combined quote for electricity and gas, rather than separate quotes
Methodology
The top 20 cities in Australia were chosen according to population figures from the World Population Review: Australia Cities by Population 2024
The annual salary per location was taken from the Australian Bureau of Statistics. This resource was last updated on 15/11/2024, and figures are drawn from the 2020 census: Data by region
To update the salary figures from the 2020 figure, we applied the suggested salary increases from 2020-2024 (the most recent report) suggested by the Fair Work Commission.
To find the net income, the Australian Government Taxation Office income tax calculator was applied: Income tax calculator | Australian Taxation Office
The sources for local prices for each amenity are as follows:
- Median rent: Australian Bureau of Statistics (Data by region) and inflated using the CPI calculator to 2025 figures.
- Electricity, Gas, and Internet quotes from MyConnect (Utility Bills: What’s the Australian Average?)
- Local grocery costs were taken from Numbeo. This is the “Monthly recommended minimum amount of money for food per person (assuming 31 days per month)” (Cost of Living)
- Public transport costs were taken from Numbeo and reflect a monthly pass for local public transport (Cost of Living)
Sources
[1] CEOWORLD magazine, ‘Ranked: Countries With The Highest And Lowest Average Salaries, 2024’
[2] Wise, ‘Cost of Living Index 2024 – Explore Living Costs by Country’
[3] Australian Bureau of Statistics, ‘Data by region’
[4] Canopy, ‘Canopy UK Rental Affordability Index: End of Year 2024’
[5] Statistisches Bundesamt (Destatis), ‘Households spent an average of 27.8% of their income on rent in 2022 – German Federal Statistical Office’
[6] Gold Coast Info, ‘Gold Coast History’
[7] DiJones, ‘How much should I spend on rent’
©️©️ This work is licensed under a Creative Commons Attribution-ShareAlike 4.0 International License.